I’ve been thinking about the performance of Greek manufacturing in the context of the internal devaluation strategy, again. I want us to take a look at a couple of charts. Here’s the first one.
 |
| source: Eurostat |
If one focuses at the turnover index for Greek manufacturing he would think that the sector is actually doing rather well. The said index has the drawback that is affected by prices’ fluctuations. I personally prefer volume or quantity indices. The readings of the volume index paint no pretty picture though. The index was in constant decline since late 2008, though it seems to have stabilized during the past few months. It remains to be seen whether this is another head-fake before it resumes its downward path or if this is here to stay. Hence, the rise in turnover comes in its entirety (even to make up for declining volumes) from price increases.
The Irish manufacturing sector seems to be faring considerably better. Volume didn’t decline much during the dark days of 2009 and the brunt of the adjustment was borne through lower prices. Furthermore, prices have been relatively stagnant for the most part of 2010 and 2011.
 |
| source: Eurostat |
For you to have a clearer picture of the evolution of prices in the sector, other than my ramblings, here is producer prices’ evolution over the past 4-5 years.
 |
| source: Eurostat |
The chart confirms that over the past two years, producer prices for Greek manufacturing have been rising steadily and heavily, while the ones for the respective Irish sector have been at best flat.
A good question is, why?
Is it because of the internal devaluation? Have wages in Ireland declined more than the ones in Greece did? The next chart can answer that.
 |
| source: Eurostat |
It seems that wages for the Greek manufacturing sector have declined considerably more than the ones in its Irish counterpart. It would be more correct to compare real unit labour costs (ULC). Irish real ULCs have declined a bit more that the ones for Greece 5,45% compared to 4,43% annualized, probably due to lower inflation in Ireland and the fact that productivity fared better in Ireland than in Greece. But then again this is no significant differential to speak of. Then what can account for the anti-diametrical picture displayed in the producer prices chart?
Manufacturing firms are capital-intensive, aren’t they? That must mean that labour inputs are not the single most important cost-factor for them. The price of their material inputs along with cost of capital should be. A look at an industrial firm’s balance sheet should be enough to verify this (again the degree of capital intensiveness is different for each sector).
But material inputs prices are the same for everyone, right? I have talked about the level of import prices in an older post. Moreover, if you put the credit crunch and the state of each country’s banking sector in the picture, the cost of capital starts to diverge as well (of course a possible credit crunch could affect import prices as well).
In my humble opinion though, the single most important factor is what comes next. Analyses, like the one above assume that the level of sophistication of even the same sectors in each county is the same and more importantly that all countries produce the same basket of goods.
Well, they don’t, hence in most cases they are not directly comparable to each other. They source different inputs, which can only mean that they are affected by different factors or even by the same factors just in a different scale.
In that older post I had blabbed about how the timing of attempting an internal devaluation on Greece is unfortunate due to the fact that commodities prices are high. I hadn’t put that into numbers but I’ll give it a try now.
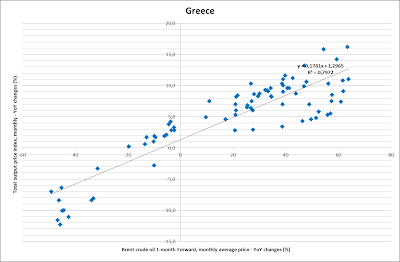
Look at how dependent the Greek economy is on oil.
 |
| source: Eurostat, ECB, own calculations |
The R2 of that rather simple regression is shocking really. Look at what the same regression for Ireland, this time, yielded.
 |
| source: Eurostat, ECB, own calculations |
That, in part, could explain the different behavior of producer prices in the two countries and add weight to the argument that the internal devaluation is unluckily pursued at a time of high oil prices.
Oil prices are exogenous but the fact that the Greek manufacturing sector and the economy in general are overly reliant on oil is not…
By all these I don’t mean that if oil and commodities prices in general were lower, Greek manufacturing would be doing better (this is a function of so many factors that I can’t even dream of writing them down), but would the sector’s products prices be in a downward trend? Moreover, that doesn’t mean that should that be the case, internal devaluation could be characterized as successful, nor would it mean that it would be less painful. The Greek external sector is so small that, in my humble opinion, all kinds of devaluation strategies (currency or internal) would probably need a long time to bear fruits.
P.S. I want to share one more weird fact with you. Usually there is a lag until oil price spikes are passed through to producer prices. What I was astonished to see is that this lag for Greece is virtually non-existent.
 |
| source: Eurostat, ECB |
P.S.2. Some more evidence of the higher dependence of Greece on oil.
 |
| source: IMF |
No comments:
Post a Comment