Friday, 10 June 2011

Highlighting a certain structural feature of the Greek economy


I know that I’ve written excessively about labour productivity. Perhaps I’ve done so to such a degree that I could rename the blog “Labour Productivity Tragedy” and the name would not look out of place. Bear with me though, since I think that today’s post angle is just a tiny bit interesting since the whole matter is looked at through the lens of a certain structural feature of the Greek economy. 

Unfortunately, the data points of today’s post are a bit dated, since they are derived from a couple of rather focused Eurostat surveys/projects. I’m sure that this doesn’t make them any less valid, since things are not likely to have changed in such a dramatic way in the intervening years.


First, the so called structural feature of the Greek economy. It is widely known from word of mouth or anecdotal evidence that the bulk of Greek firms are rather small and mostly fall into the SMEs category. Here is some official Eurostat numbers circa 2007.


source: Eurostat


To delve a bit deeper we can say that Greece has the highest % of micro enterprises (1-9 employees) in the EU, the second lowest % of small enterprises (10-49 employees), the lowest % of medium enterprises (50 – 249 employees) and again the lowest % of large enterprises (over 250 employees).

In order not make your eyes bleed from too many graphs I will only put on the relevant graphs for micro and large enterprises.


source: Eurostat

source: Eurostat


Based on another Eurostat survey, circa 2005, for most sectors labour productivity increases in line with the firm’s size (measured by the number of employees). There is a newer survey for 2007 (with some individual sector figures dating back to 2006) but I’ve chosen to use this one because it has an aggregate productivity figure for manufacturing.


source: Eurostat

In the chart above I’ve plotted labour productivity for micro, very small, and small enterprises. The relevant figure for utilities is obviously an outlier and it makes the other labour productivity differentials seem trivial but I’ve plotted the differentials in another chart later on.

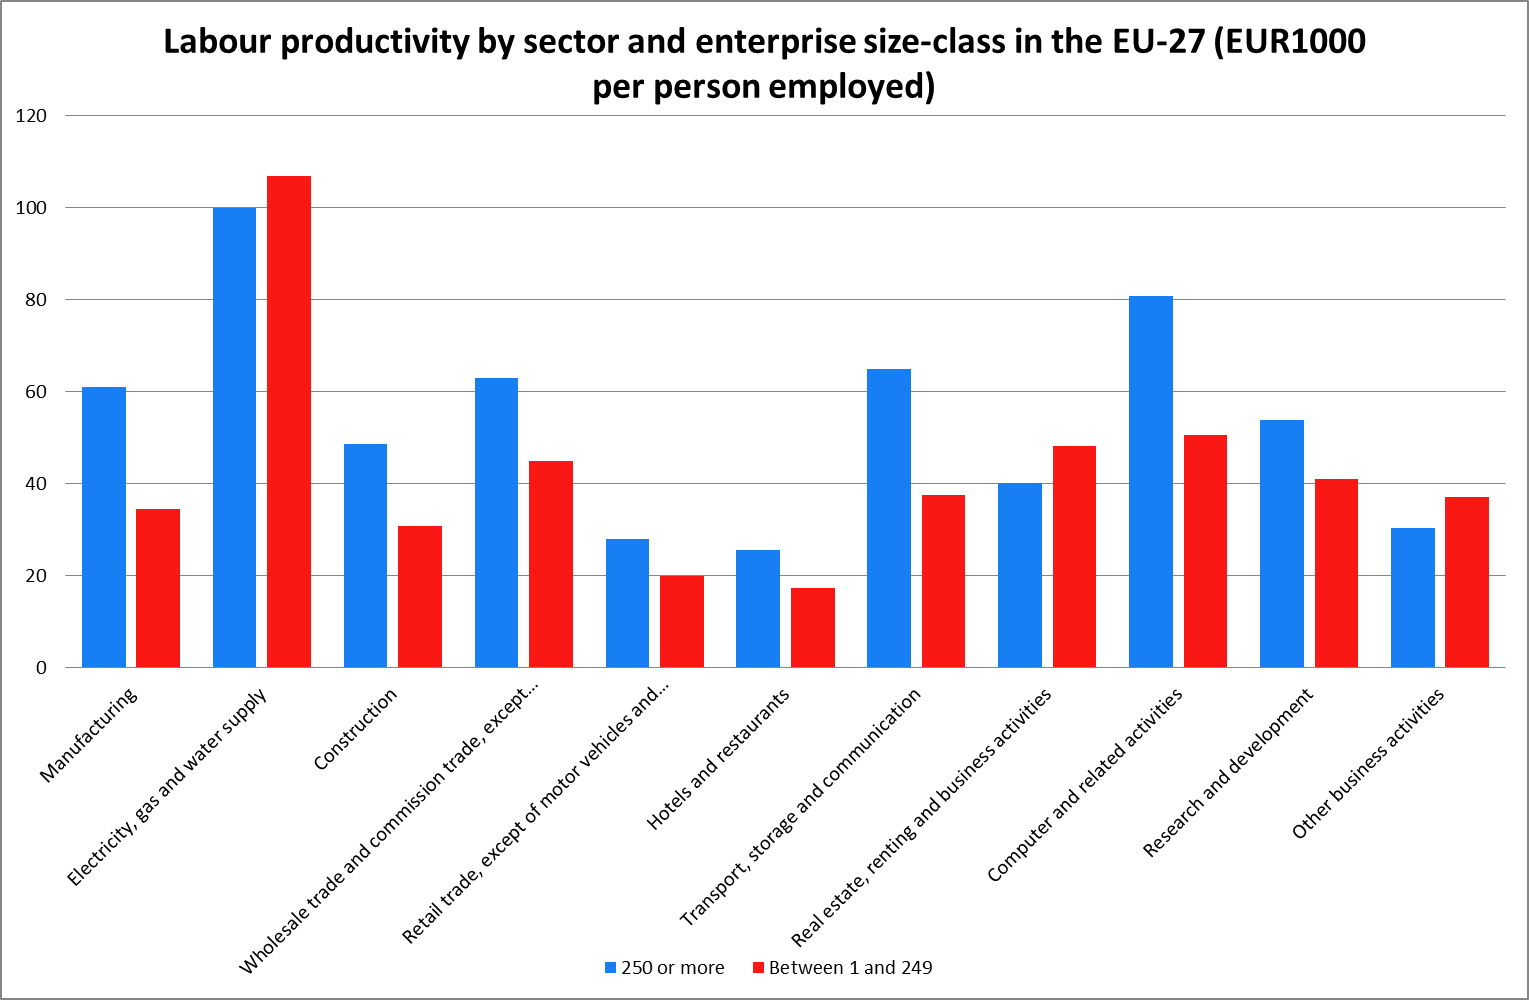
Here’s the chart for medium and large enterprises.


source: Eurostat

 And here’s the chart showing productivity differentials among firms of different size classes.


source: Eurostat

For the vast majority of the sectors pictured in the charts, labour productivity increases in accordance with the firm’s size. I can point out two notable exceptions; utilities and other business activities. For the first one, the implications for Greece due to its renewable energy sources potential are obvious. As far as the second one is concerned, no matter how hard I looked it up, I couldn’t find what it includes, if anyone has a clue please do enlighten me.

As you can notice with even a cursory glance at the second chart, all Mediterranean countries exhibit high % of micro enterprises. Could this (besides any regulatory, financing or other unique domestic issues) be attributed to the cultural features of the said countries? Or the temperamental features of the countries residents?


Wednesday, 8 June 2011

A look at sectoral productivity

For the umpteenth time I’d like to talk about labour productivity. I charted the trajectory of an alternate labour productivity measure, Gross Value Added per person employed in constant prices. One drawback of this particularly measure that springs to mind immediately is the fact that using total employed persons instead of hours worked treats full-time and part-time workers the same.  This could potentially lead to miscalculation of labor productivity, but it’s the only measure that I found in real terms. I think that it’s pretty interesting to see how labour productivity of different sectors fared in real terms.

Once more I used data about the three bailed out countries Portugal, Ireland and Greece. 


source: AMECO


As far as primary production is concerned there was a significant rise in real labour productivity during the last 15 years on aggregate but this was by no means a straight line growth. Any growth during the years charted up until 2008 was driven by the decrease of persons employed. The significant increase though, during the past three years, can be attributed to the spectacular rise in output mostly. What could potentially make the figures fishy is whether there was a lot of informal labour employed in the sector. This could mean that the rise in productivity could stem from a switch from formal to informal labour, which would just cancel any such increase. I doubt that the post-2008 increase could be attributed to that though since there was a slight increase in primary sector employment. But again I could be totally wrong here.


source: AMECO

Labour productivity in real terms for the construction sector went nowhere during the last 15 years. Here the differential between Ireland and the EU15 average and Greece is much smaller.

If we take a look at the relevant figures for manufacturing, I think that one could blink in disgust. The EU average is essentially double (or even more towards the end of the decade) the level of Greece, while the figures for Ireland are simply exorbitant. We have talked in the past about the capital intensity for the Irish economy and how much higher it is or about the high levels of inward FDI, both of which tend to work towards rising labor productivity, but the number for Ireland is out of this world. It is true that Gross Value Added of several Irish industrial products is pretty high due to their high technological content, but the number is shocking nonetheless.


source: AMECO

Finally, for the services sector where most Greeks are employed (at least for now), productivity differentials are lower again. 


source: AMECO


The key takeaway is pretty clear; Greece suffers from a severe productivity hysteresis. The said differentials are abysmal for sectors with a high technology content (manufacturing) and are a bit lower for sectors with a lower technological content (services, construction).

An alternate reading could be that the tradable sector suffers from low productivity, hence low competitiveness, while differentials are lower within the non-tradable sector.

Given that the domestic market will probably shrink dramatically during the next few years, if we want to stand any chance to (re)improve Greece’s living standard, in solid foundations this time, the tradable sector needs, among other things, a productivity boost. A high level of inward FDI, legislative change and a better business environment in general could help, but these are easier said than done. I could think of several other things that could also help, but I can’t see any moves towards them materializing presently…


Friday, 3 June 2011

A true Greek tragedy: FDI

Just another quick post today, maybe I'm having a laziness relapse lately. 

After trawling through Eurostat data I found some data point that rarely gets mentioned, so I thought that it would be interesting to share.

It is about foreign direct investment (FDI) but not FDI flows but rather FDI stocks. FDI stocks is the total amount of productive assets under foreign ownership in the host country.


source: Eurostat

I plotted data for the three bailed-out EU countries and guess what, Greece is the laggard again. I don't have to spell out what that means. Its implications are obvious both for job creation and as an indicator for our country's institutional quality and its attractiveness from a business environment point of view. It could also have some implications from a geopolitical point of view but I'm not going to go into that either. Well, you could ask, what are you going to go into then? Just presenting the datapoints really, you can blame my inherent laziness, which is compounded by the heat in Athens today...


source: Eurostat

The chart above shows Greece's outward FDI stock. Again the differential from the two other bailed-out countries is embarrasing. Well, why that is so of course is anything but simple (financing, international connections, managerial know-how etc.) but again it speaks volumes about how inward-looking we Greeks are...

P.S. You could think, wait, you are constantly criticizing your fellow Greek people for their many flaws but today's post was rather short and not that illuminating at all, and for that you're blaming your laziness, isn't that overly contradictory? And my answer is; of course it is, but then this just another awfully common Greek trait...

P.S.' I expect that Greek inward FDI stock kept shrinking during 2010 since a lot of foreign companies subsidiaries upped and left. I also wouldn't be surprised if Greece's outward FDI stock shrank during 2010 as well, since some Greek firms had to sell their foreign subsidiaries in a desperate attempt to gather liquidity. I've touched on that before in an older post.

P.S.'' This is the last one I swear. I thought that in order to make up for my laziness before I can do a couple of scatter plots to show the relative positions of the afore-pictured countries compared to their EU counterparts and the large OECD countries (USA, Japan), Turkey and Iceland. The coloured dots are, black for Greece, green for Ireland and red for Portugal.


source: Eurostat

source: Eurostat

I intently chose 2007, when the world economy hadn't entered recession, since FDI tend to be rather cyclical, hence largely affected by the ups and downs of the business cycle, let alone the worst recession/depression the world has witnessed since the Great Depression.