Sunday, 30 August 2015

The (potential) effect of capital controls on employment

There's a lot of talk in Greece regarding the impact of capital controls on employment. Since employment data are published with a great lag (and an even greater one over here) one way to gauge their potential impact is through DG ECFIN's leading indicators.

Employment expectations indicators for Industry and Services surely paint a pretty dismal picture.

source: DG ECFIN

One could think that this doesn't carry much weight since it is just an expectations indicator and these are not immune to overreaction or survey participants' judgement errors. It would be informative to see how those indicators predictive powers have fared in the near past. 

I turned DG ECFIN's survey data into quarterly by computing the quarterly averages in order to compare them with actual employment changes. Since constructing an composite employment measure for services would take some time I've just included industry data in the chart but these are more than enough in order to get a sense of things I think.

source: DG ECFIN, Eurostat, own calculations

The employment expectations indicator reacted a bit quick in 2009-2010 but actual employment changes eventually (and sadly) caught up with its "predictions". Of course, there is prior experience of how the said indicator reacts to the imposition of capital controls, in Cyprus.

source: DG ECFIN, Eurostat, own calculations

In Cyprus the said indicator had put in a bottom (as we can see ex-post) before the imposition of capital controls and their effect was a mere blip since the indicator rebounded the next month. Of course, the setting was quite different there, since this was right after election while over here we got elections coming up (yet again) next month. And these prolong, the already sky-high, uncertainty.

To wrap this up, only time will tell what capital controls' actual impact on employment will be. Yet things, ex-ante, are not looking that good. Let's hope that reality will prove these pessimistic omens to be false.

Friday, 28 August 2015

What drove GDP growth in Greece during Q2 2015?

Many people, myself including, were quite surprised by 2nd quarter's Greek GDP print. I think that it would be interesting to take a quick look at the drivers of GDP growth.

source: ELSTAT, own calculations

I deconstructed GDP growth using my usual simplistic method. Per that, the biggest contributor was households' final consumption expenditure. Imports' plummeting was an important driver as well and finally, general government final consumption contributed a bit too. People looking at nominal figures published in budget execution bulletins and being puzzled due to the hefty decreases recorded there should keep in mind that the figures I used here depict volumes. 

What puzzles me is the fact that, unlike during 2014, the increase in household consumption was accompanied by a decrease in imports (essentially the first such occurence since late 2013) which usually means a decrease in household consumption as you can see in the chart. Imports' decrease is probably going to act as a buffer for GDP growth in Q3 as well, where capital controls are going to have quite a fierce negative impact on imports.

Monday, 24 August 2015

Relative reliance of Greek Banks to ECB funding is now higher than what it was in 2012.

It is no secret that the Greek banking system is (once again) heavily reliant in ECB funding. What's less obvious at first glance is that although in absolute terms, its reliance is lower that what it was at the 2012 peak, in relative terms its reliance to CB funding is now, in fact, higher.

source: Bank of Greece

No matter which yardstick one chooses to measure it against (e.g. Total Assets or GDP), the statement above stands.

source: Bank of Greece, own calculations

source: Bank of Greece

Happy times.

Monday, 17 August 2015

Greek Industrial Production and Euro's devaluation effects


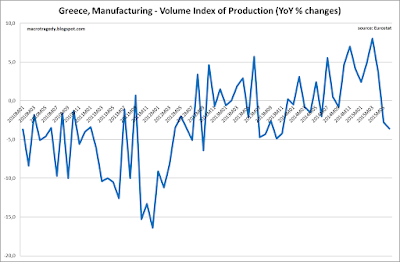
I found the “appetite” to do a post after a really long time. What puzzled me these past few months was the rise in Greek manufacturing production the first few months of 2015 (until April at least that is). Of course this seemingly dry issue has some quite important implications on which I’ll touch later in the post.

source: Eurostat
The reason I was puzzled was that SITC (Standard International Trade Classification) data showed industrial exports to be falling in volume and domestic demand is rather anemic to justify such robust increases. Since I use Industrial Production and not Turnover, Volume data have to be used for comparisons and conclusions reached to be meaningful.  SITC data literally refer to volume since they are expressed in kgs. 

I summed up some industrial goods categories (namely, Chemicals and related products, Manufactured goods classified chiefly by material, Machinery and transport equipment and Miscellaneous manufactured articles) to reach the figure shown in the chart below and which I dub “Broadly Defined Industrial Products”. Not very creative, I know. 

source: Eurostat, own calculations

Last night I had an epiphany and checked data from one of the other trade classifications, namely BEC (Broad Economic Categories). Data from BEC justified the robust increases in Industrial Production since they showed solid increases in merchandise exports volume for the months until April.

source: Eurostat

Generally, data from BEC and SITC coincide, more or less, but (besides early 2015) they have showed divergences in a few other occasions featured in the graph. I haven’t come up with an explanation for what drives those divergences, since I am not very fluent in the classifications’ technicalities but implications of the divergence here could stretch beyond a technical issue. They could determine whether Euro’s devaluation in the second half of 2014 actually had a meaningful effect on Greek merchandise exports. Of course, falling Oil prices may have a further deflationary effect on prices (besides domestic deflation In Greece) here and may make apparition of this effect on value terms even harder. Well, we have a hung jury here, BEC data say it kind of did, while SITC data say it didn’t. Of course, one might be excused to think "if the said effect was indeed meaningful wouldn't it show on both datasets?" and I would be inclined to agree there...